Happy Friday!
As promised, I tackled the yield curve this week. I’ve meant to write about this for years, but explaining the yield curve and its importance to clients has always been tricky. Hoping this sheds some light without getting too technical (reach out if you’d like a copy).
The short version is that:
- The yield curve has predated, not predicted, every recession since WWII.
- It’s not a trigger switch but rather an indicator to better understand why it inverted and then see if any of those drivers can also risk a recession.
- When recessions do happen, they average about two years after the inversion. Being right but early is the same as being wrong.
This is 100% worth watching closely, but as of now, it’s too hard to say if this inversion is the real deal or yet another Type I error (geeky way of saying false positive).
Now let’s dig deeper into the three D’s discussed in this weekly: drivers, duration, and depth. Consider this supplemental info that didn’t make it into the weekly because I didn’t want to hit readers with too much information at once.
Drivers
The 10yr-2yr portion of the curve inverted this week. The consistency of this indicator is alarming to many investors because each time the line in the chart below dips below zero, a recession (shaded area) happens sometime after.
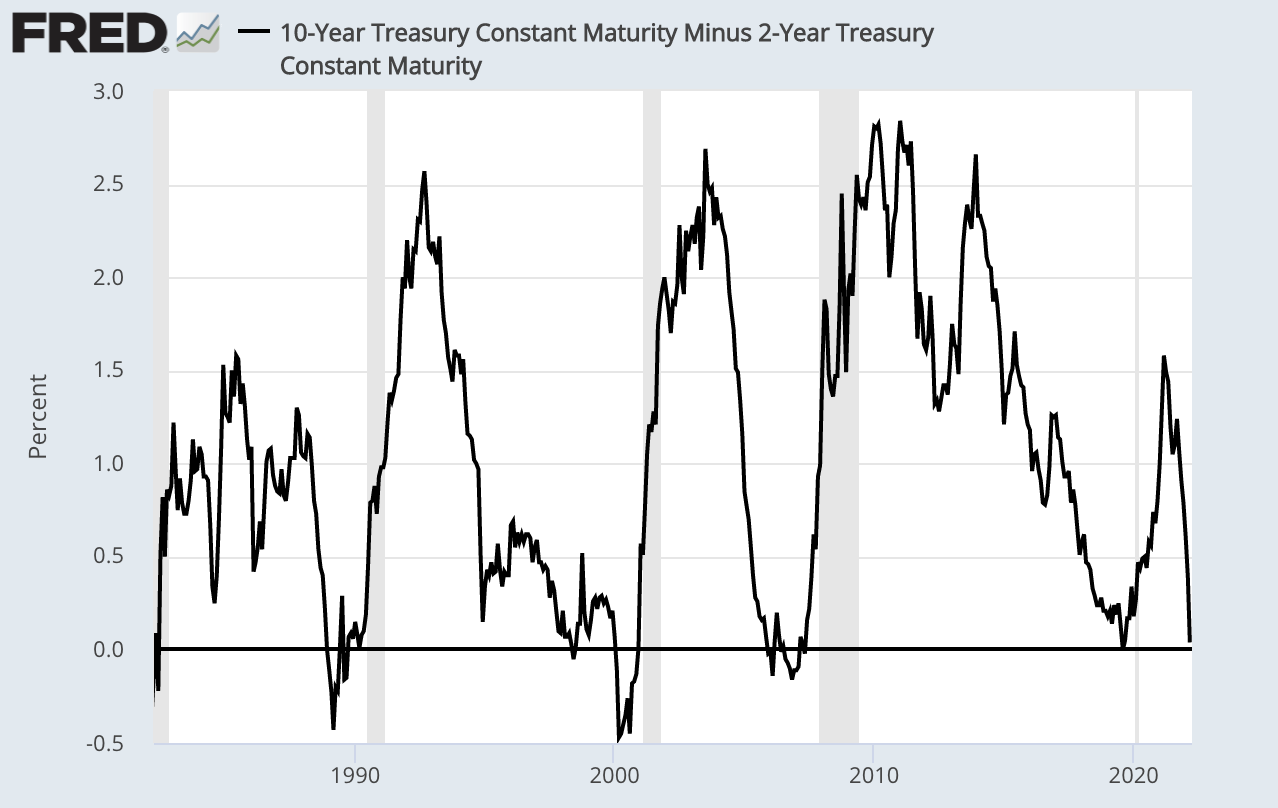
There’s no way around that inflation expectations are a key driver in this inversion, and historically that’s been bad. Every inversion associated with inflation expectations has resulted in a recession. But not so fast…
Duration
As I’ve said a thousand times, inversions are NOT trigger switches. And if you blinked too long on Wednesday, you would have missed this inversion. The 2-10 curve needs to stay inverted longer than a few seconds to inflict any real damage to the economy.
Depth
The depth also matters a lot. Mild inversions aren’t a big deal, and this week was as trivial as it gets. I’m talking dipping the tip of a pinky toe in the water mild. For scale, the 2-10 spread hit negative 241 bps (-2.41%) in March 1980, right before Volker unleashed hell and raised rates to 20%. That’s a real inversion.
Three questions left unanswered…
First, I wonder just how informative a yield curve inversion is today relative to pre-2008. Today, the Fed is way more involved in the bond market, and its presence distorts everything. And what happens if the 2-10 curve stays inverted for some time? Would the Fed get even more involved via “yield curve control,” which basically means reshaping the curve to their liking?
Second, I wonder if the $3ish trillion in excess reserves on banks’ balance sheets will dilute the inversion’s efficacy as a recession indicator. The last thing banks need right now is more deposits, so will this massive supply of cash decouple deposit rates from the short end of the curve?
Said another way, if short-term rates rise to 3%, but banks still have a ton of cheap capital, will it impact their margins the same way as in prior cycles? I’m not smart enough to know the answer to this one, but it’s a question that’s been on my mind.
Third, a key reason why an inverted yield curve was so informative in the past was that bonds offered a relatively attractive return during periods when it was inverted. Does that “substitution effect” exist today? I’m skeptical.
Maybe it will a year from now. I don’t know. But right now, I’m unsure how selling one of the few/best inflation hedges out there (stocks) makes sense.
Strategic Petroleum Reserve
The U.S. maintains a bunch of holes in the ground that hold a lot of oil called the Strategic Oil Reserve (SPR). It’s meant to act as an emergency stash during supply issues, etc. This week, Biden announced that he will release 1 million barrels per day for the next six months. The goal is to alleviate some of the pricing pressures we’re all feeling at the pump right now.
The U.S. consumes around 20 million barrels/day, and around half is gasoline. So, if we take 1 million barrels for 180 days (six months), that means 180 million barrels could be depleted from the SPR. Take 180 million and divide it by 20 million, and that comes out to about 8 days of consumption. This doesn’t feel like it’s enough to move the needle.
Here’s another problem. Unless the government chooses to convert those holes in the ground into skateboard parks, this is a zero-sum game (take out 180 million barrels only to replace it all later). The market will assume the government will want to refill, so the price will reflect these expectations. Right?
Anyway, this isn’t meant to sound political. I’ve never understood the SPR, irrespective of who’s in office, so let’s shift gears. What I can’t figure out is how releasing reserves actually works. The government bought a bunch of oil a while back to fill the SPR, and now they’re releasing this oil into the economy. But do they sell it to refineries and other consumers of oil?
If so, it will be an excellent trade for the government. Think about it. Let’s say their average purchase price of oil is $60/barrel. If they sell at an average price of $90 over the next six months, then Uncle Sam’s raking in $5.4 billion in profit (($90-$60) x 180M). I’m not even going to ask where that cash will go.
Important update
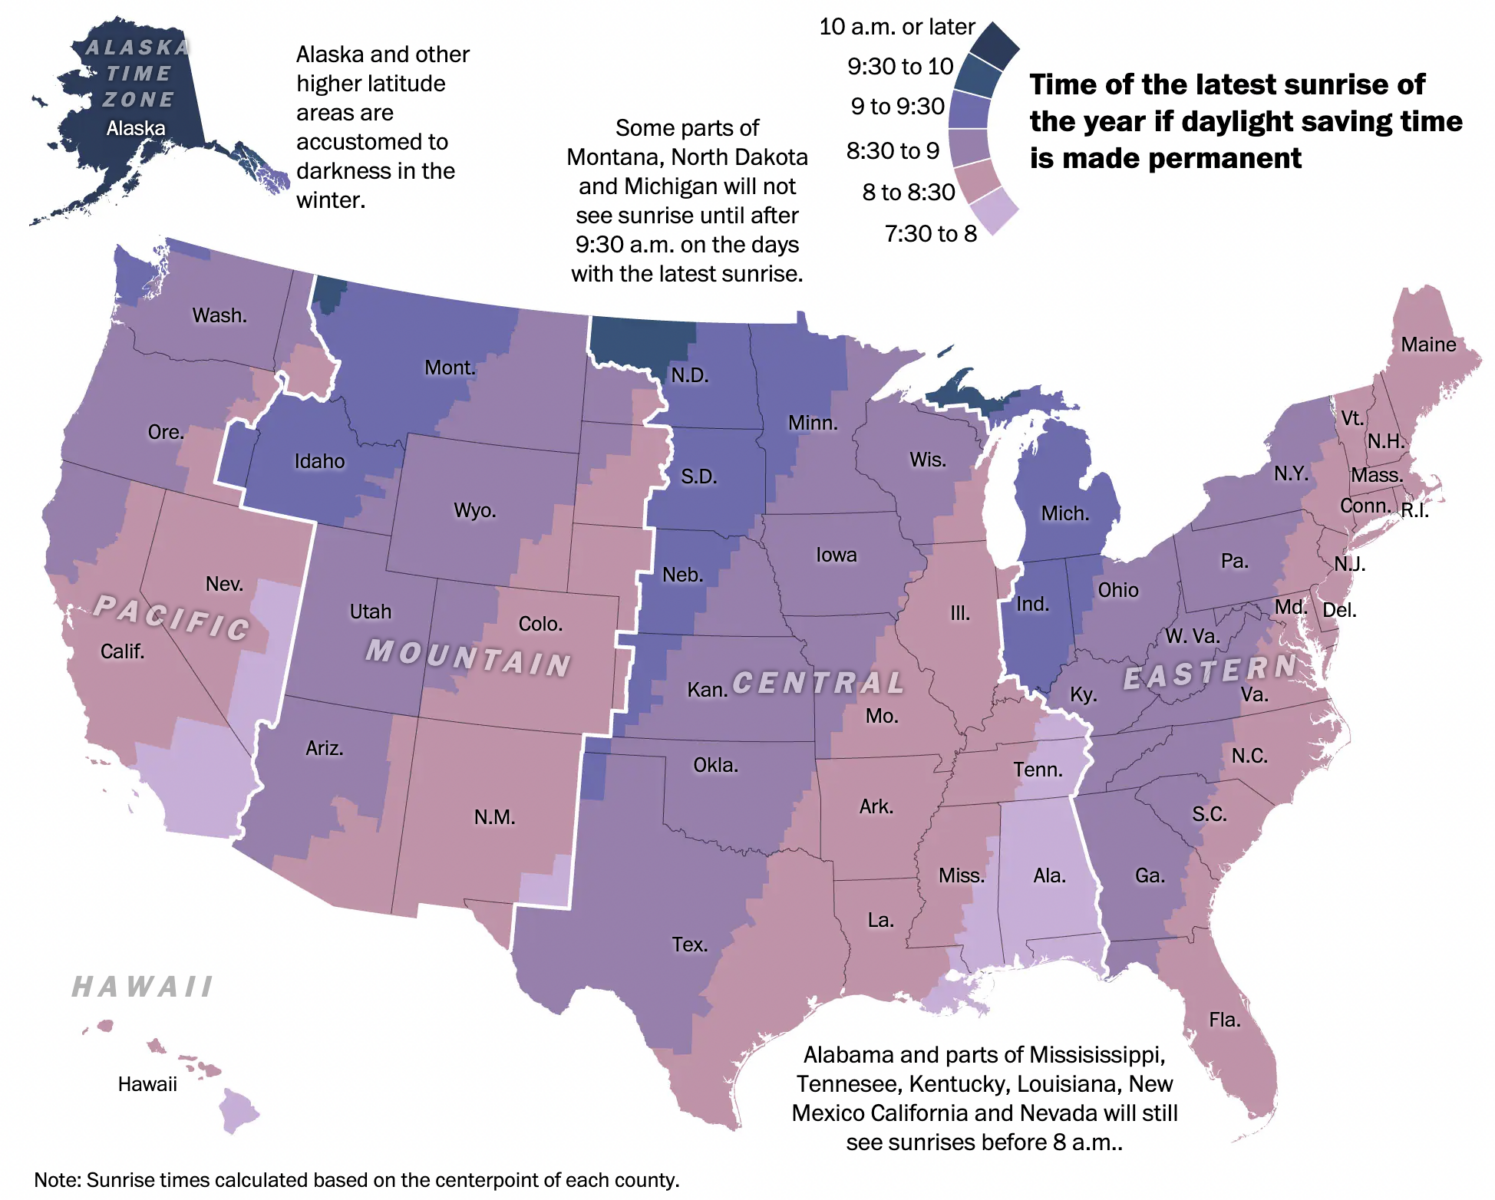
A few weeks back, we discussed the bill spearheaded by Marco Rubio to make daylight savings permanent. This has created a heated debate about making daylight savings permanent or regular time permanent. Here’s the argument for the latter:
Personally, I love dark winters. It reminds me of my days on the sell side – getting out of afternoon research meetings in NYC and being dark at 4:30pm. Something was electrifying about walking out and knowing that it was socially acceptable to use the darkness to justify skipping the gym and heading straight to happy hour. As Springsteen once said…. Glory Days.
Enjoy the weekend…

You must be logged in to post a comment.