Happy Friday!
The Volatility Index (VIX) is computed by the Chicago Board of Options Exchange. This gauge is the de facto standard for measuring and tracking equity market volatility, and many consider it the “fear gauge” for stocks.
The VIX measures the implied volatility in near-term put options on the S&P 500. The higher the volatility in these options, the higher the VIX and media coverage surrounding the VIX.
Here’s a cool chart that I found this week. When the VIX is above 30, it tends to be bullish, but the tail risk also increases. Stay with me because this may get a little geeky…

VIX below 12 is the tallest and slimmest distribution. It represents when clients sleep the best and are happiest because it’s quiet.
But notice how the right side from the average (peak) is steeper (falls faster) than the left side. This implies that periods of low volatility have a higher probability of future downside than upside, and when there is upside, it’s not as much.
Low volatility having more downside risk may seem counterintuitive, but the VIX is a “mean-reverting” index. When it is below its long-term average, it tends to rise to that average (around 18-20, depending on the timeframe). Volatility also acts like a compressed spring, where the farther down it goes and the longer it stays there, the more violent the release.
VIX above 30 has a higher average (peak is further to the right than the other two peaks) with a wider distribution (larger range of possible outcomes) AND “fatter” tails (the height of the two tails off the y-axis).
This implies that high volatility is bullish for stocks BUT also increases the risk of black swans like March 2020, GFC, etc. No matter what your time horizon, these are the events that nobody in their right mind wants to be invested through.
However, don’t forget there are two tails. The one on the left is where black swans live, but the one on the right is awesome for bulls. These are the bumper returns in stocks that make us all feel like geniuses and invincible to loss.
Herein lies the challenge as an allocator. As much as you want to avoid the left tail, you don’t want to do anything that eliminates the opportunity to participate in the right tail.
It’s good to live here
We’ve talked about how net worth for Americans has exploded over the last two years, not just for the rich. Here’s more detail to show how and where that net worth increased.
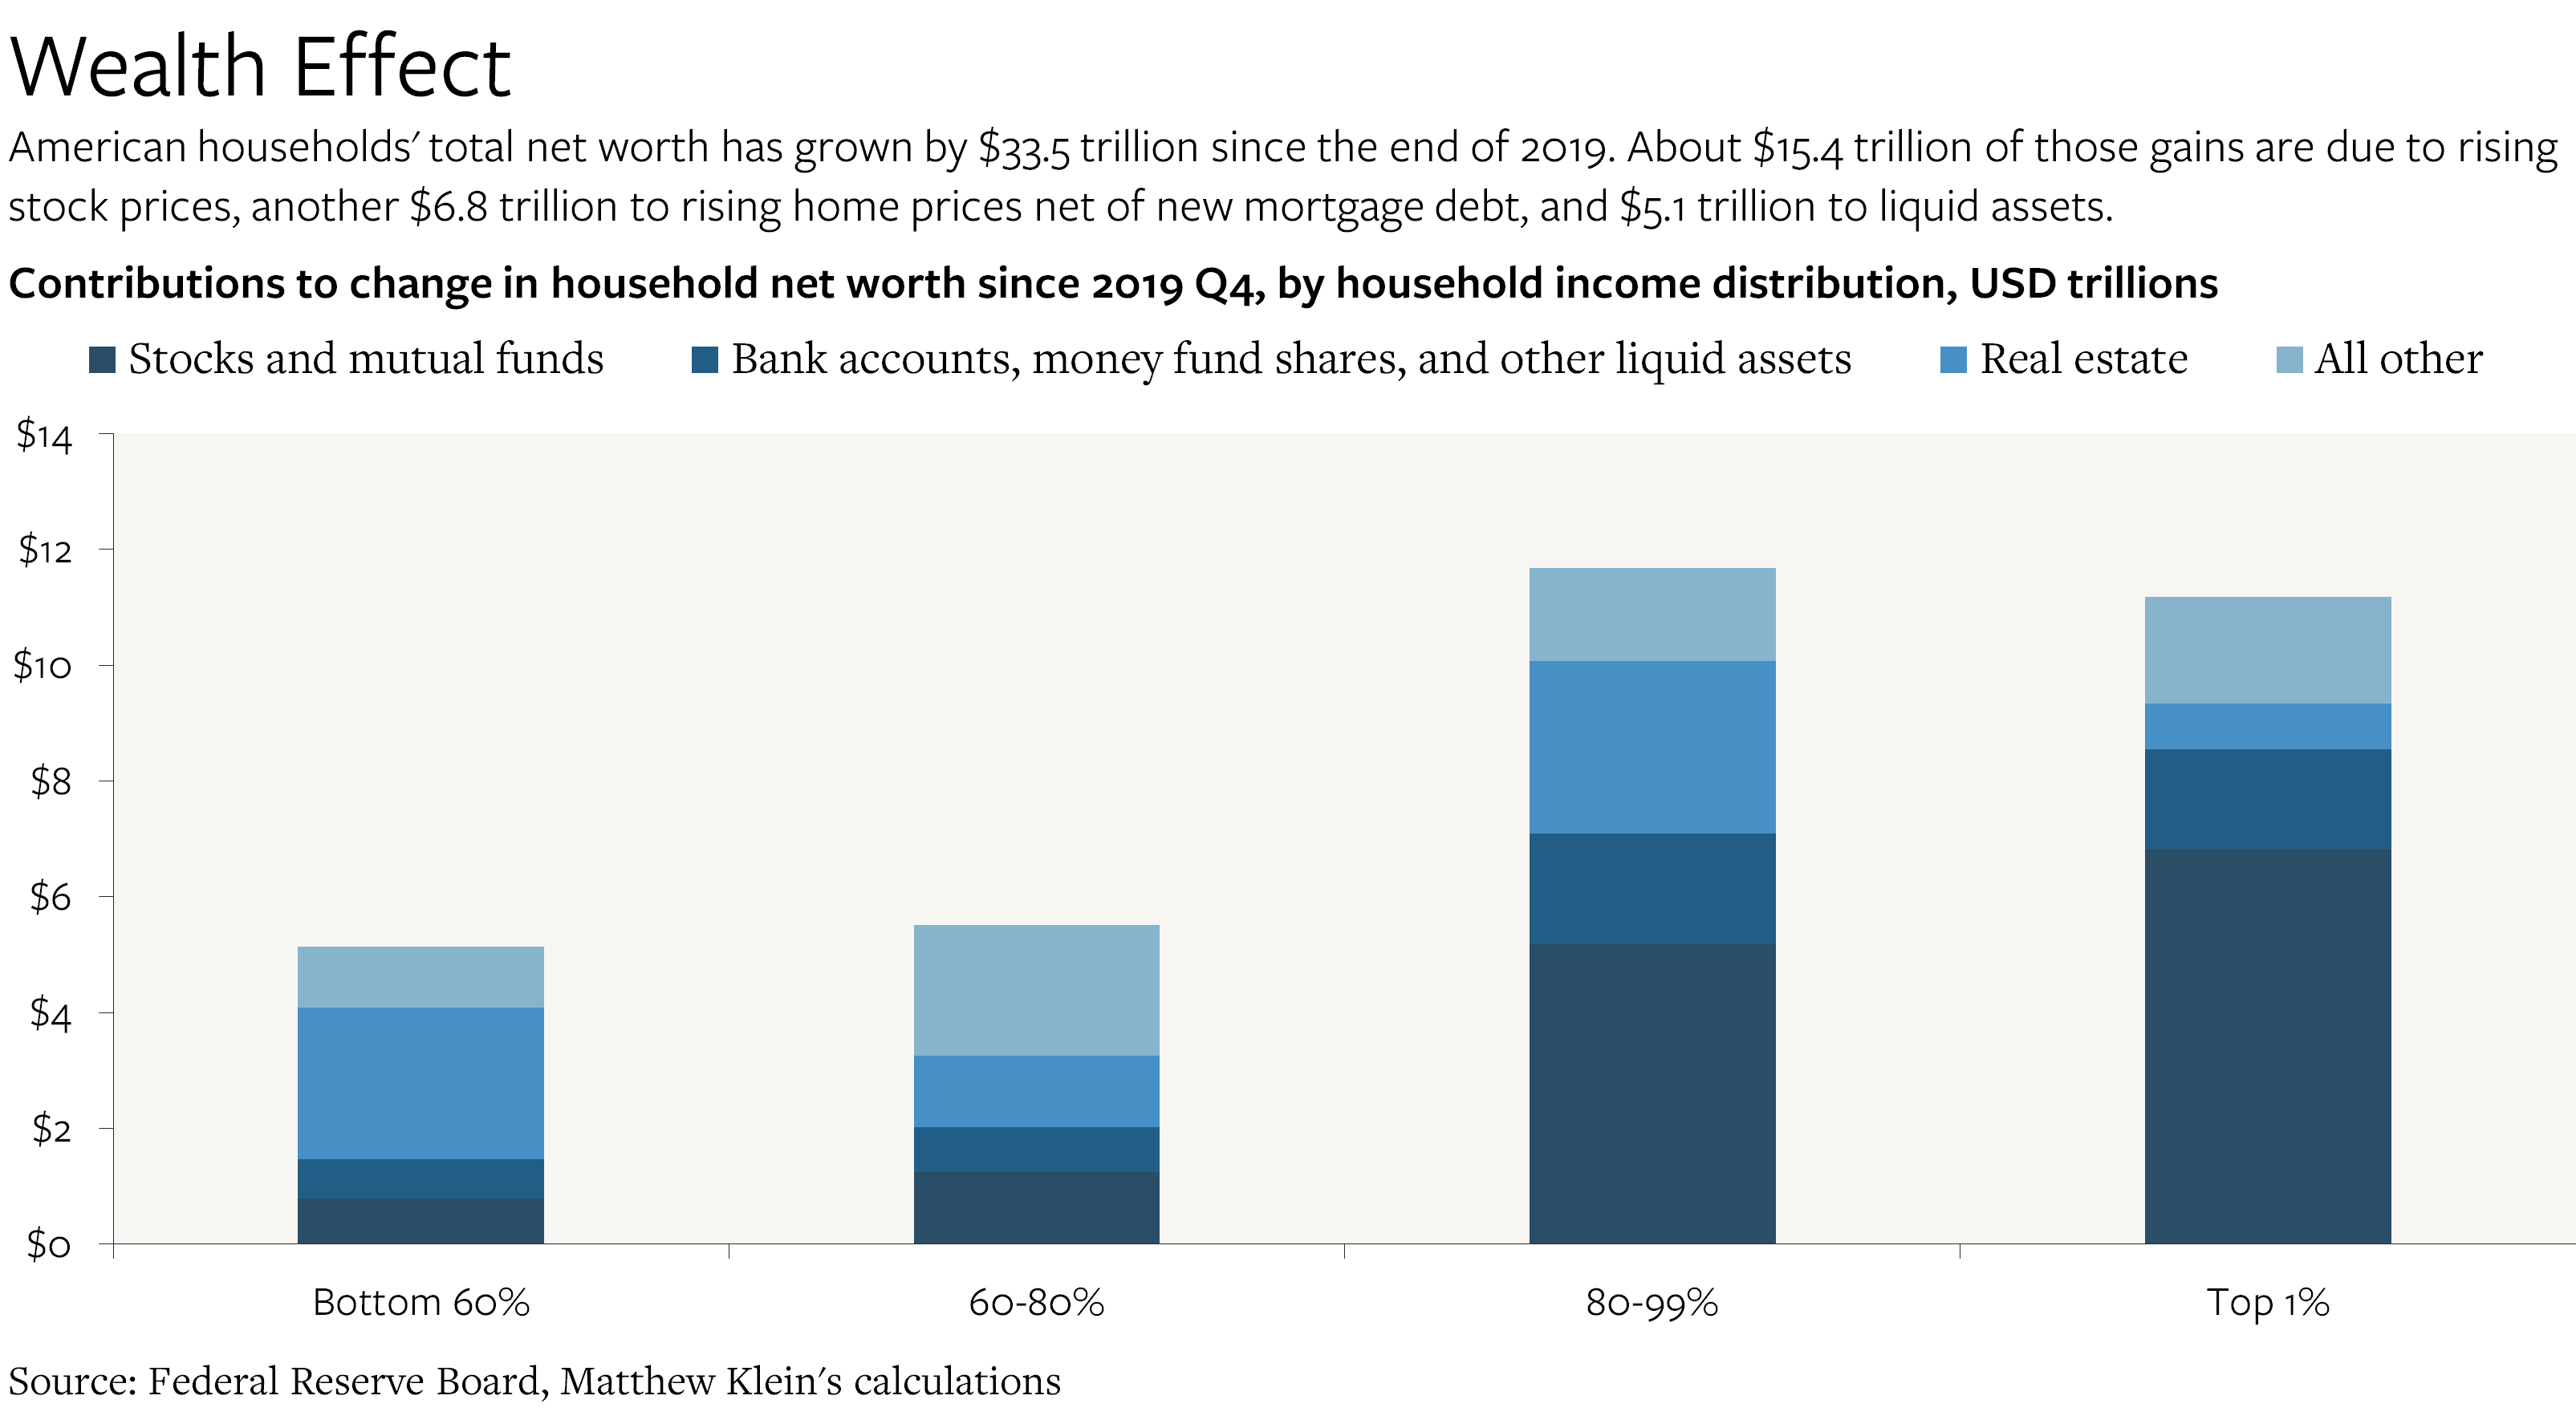
Americans’ total net worth at the end of 2021 was $35.5 trillion, or 29% higher than at the end of 2019. This is due to higher asset prices (stocks and home equity) and debt reduction. Yes, Uncle Sam paid for Louis Vuitton bags, but those stimmy checks also went to debt reduction.
The net result is a massive wealth effect for each group in the chart above. For example, Americans in the bottom 60% of the income distribution have experienced a 24% increase in their holdings of cash and equivalents since the end of 2019 and a 30% increase in their home equity.
Perhaps this will dampen or delay the negative consequences of inflation. The reason I say that when debts go down, it’s almost always at the expense of savings, but not this time. There’s $2.4 trillion in excess savings right now that remains mostly untapped. That’s a lot of firepower for Americans.
Enjoy the weekend…

You must be logged in to post a comment.