Happy Friday!
This week is about leading indicators I’m watching closely and why. The key point here is that no data point is a trigger switch, nor can any one act on its own. That’s why this job is so hard and forces you to adopt an alcohol tolerance normally reserved for Irish dockworkers (name the movie without googling).
Moving on…
January delivers
The S&P 500 just logged its best January in four years, and the Nasdaq’s January gain was its best since 2001.
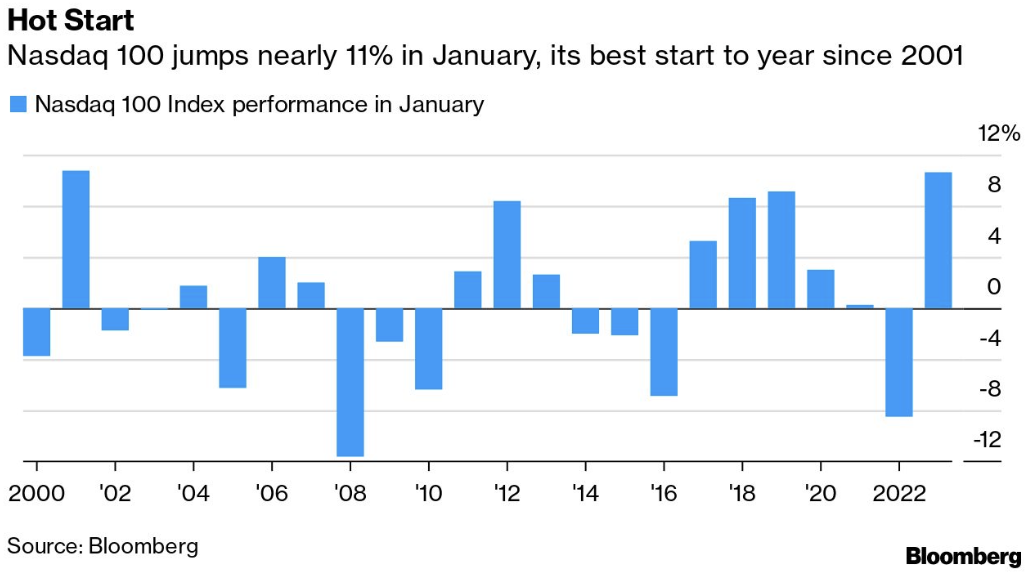
There’s an old saying, “as goes January, so goes the year.” History confirms this maxim: The Nasdaq has averaged a 14% rise through the rest of the year after gaining 10% or more in January. Giddy up.
A very uncomplicated formula
Gold is up over 18% since November 3rd, and there’s an interesting article in the Financial Times this week as to why.
Spoiler alert: It’s not because gold is some hedge against inflation. If it were, this chart would have looked a LOT different before November 3rd:

From the article:
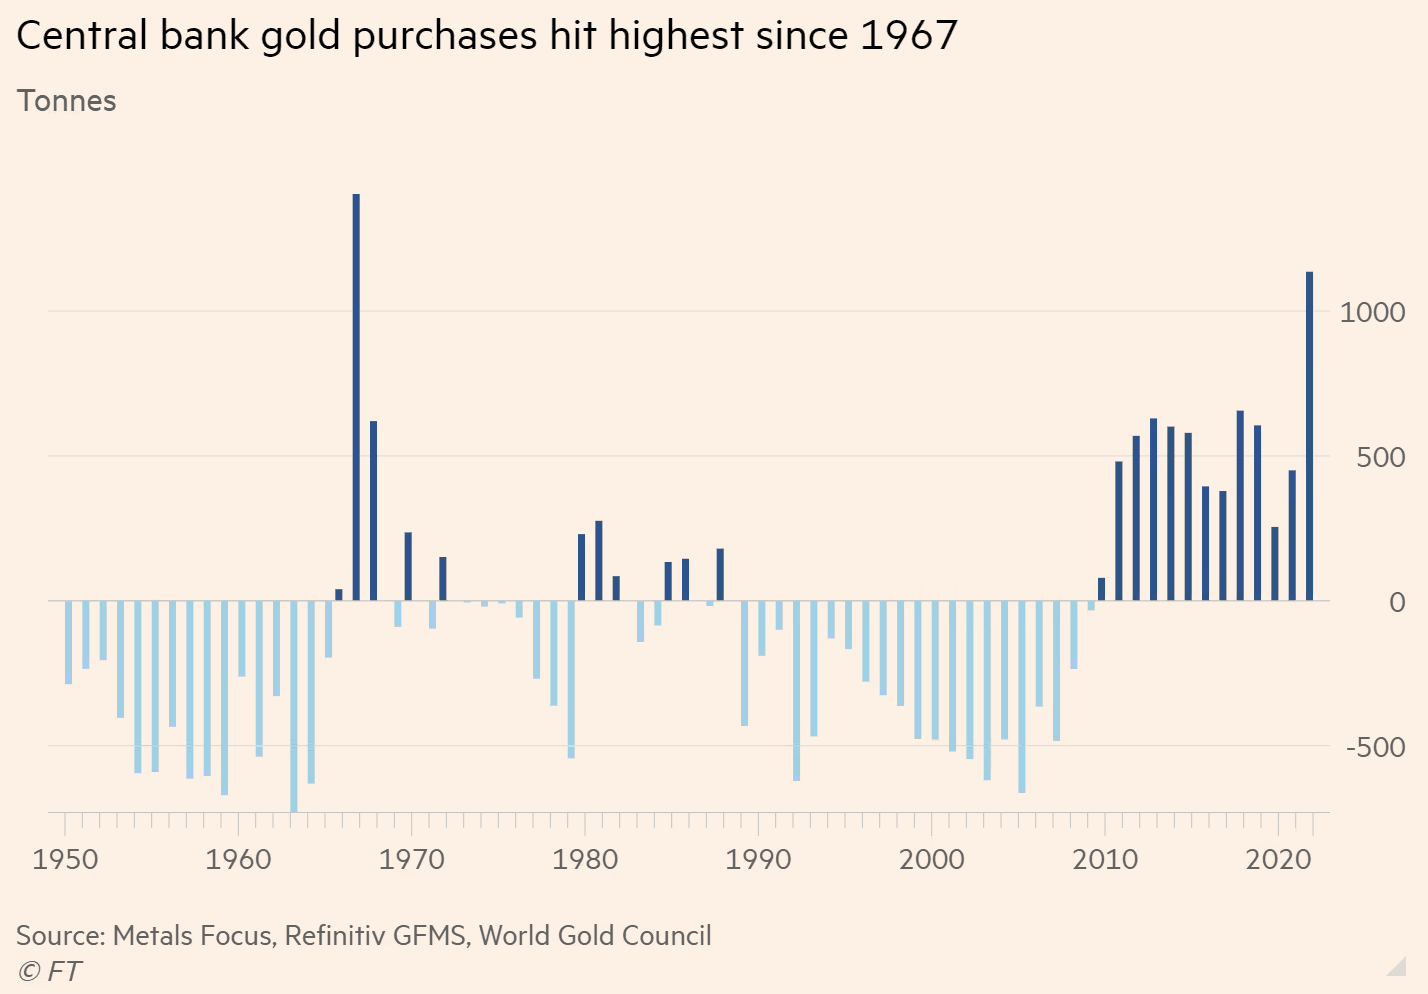
“Annual gold demand increased 18 percent last year to 4,741 tonnes, the largest amount since 2011, driven by a 55-year high in central bank purchases, according to the World Gold Council, an industry-backed group.”
That’s right. Central bankers can’t get enough of this shiny pet rock. But again, it’s not because of inflation, but rather…
- After the U.S. sanctioned Russia and froze their reserves, other countries that don’t align with our ideals decided to dump dollars for gold.
- A lack of “counterparty risk” was a key attraction for central banks, compared with currencies under the control of foreign governments.
The chart below shows how much gold these bankers gobbled up last year.
Jim Grant, the editor of the very closely followed Grant’s Interest Rate Observer, said it best:
“To me, the gold price takes the form of a very uncomplicated formula, and all you have to do is divide one by ‘n.’ And ‘n’, I’m glad you ask, ‘n’ is the world’s trust in the institution of paper money and in the capacity of people like Ben Bernanke to manage it. So, the smaller ‘n’, the bigger the price. One divided by a receding number is the definition of a bull market.”
It seems like this article further supports Mr. Grant’s theory.
The exodus continues
Here’s an interesting chart summarizing the migration data that came out this week. Nothing overly surprising, but these are not small numbers either. Curious how many 1%ers are in here because the three states in the bottom left need them to stick around.

Simple pleasures in life
It’s safe to assume that these tech layoffs give us all a warm feeling inside. Not because they are bad people, per se. It’s just that 70% of big tech payrolls don’t do anything. They can’t. It’s mathematically impossible.
In all seriousness, I’ve never understood why big tech hired more PhDs than Boston. It makes absolutely zero sense because tech is about doing more with less, right?
So, when tech Millennials post stuff like this, nobody who has ever held a real job and/or worked like an animal to keep a job can possibly feel bad about what’s going down right now.
And that’s not even factoring in this work from home movement that lasted almost as long as Occupy Wall Street. Pull this into the mix, and it’s hard to not want entire divisions to get blown out.
That’s why I laughed when I saw this meme earlier in the week.

Oh, and this one too…

Enjoy the weekend…

You must be logged in to post a comment.